|
Pipers Pub monitoring site, SUMMER 2019 - 2021 Pipers Pub monitoring site, FALL 2019 - 2021 GNPCC monitoring site, SUMMER 2019 and 2021 GNPCC monitoring site, FALL 2019 Morningside Park monitoring site, SUMMER 2019 - 2021 Morningside Park monitoring site, FALL 2019 - 2021 Walley Creek at Hammond Bay (Footbridges) monitoring site, SUMMER 2019 - 2021 Morningside Park monitoring site, FALL 2019 - 2021
0 Comments
Map of Monitoring Sites
2020 Results SummaryOn June 4 the Regional District of Nanaimo (RDN) Drinking Water & Watershed Protection Program (DWWP) released the 2020 report summarizing data collected by Streamkeepers groups through their Community Watershed Monitoring Program. This was the Walley Creek Streamkeeper's fifth year participating in this program! We use the data to better understand anthropogenic affects on the water quality, and to guide restoration efforts. We look at the results to see where the water quality readings are exceeding standard guidelines for temperature, dissolved oxygen, specific conductance, and turbidity. Temperature Walley Creek had the potential to exceed the aquatic life guideline (17 degrees Celsius) in the summer of 2019 and 2020. This parameter is influenced by air temperature, upstream influence and physical stream attributes, however, it was noted that summer 2020 was wetter and cooler than previous years (see pg. 24 of the report). The report suggested restoration efforts to mediate the effects of high temperature include: groundwater conservation and riparian enhancement and restoration. Dissolved Oxygen (DO) The guidelines state that the average dissolved oxygen should be above 8 mg/L, and should not drop below 5 mg/L (instantaneous minimum). Dissolved oxygen is influenced by several factors, but low DO is commensurate with high temperatures. Walley Creek was below the average in the 2020 summer monitoring period, and at Morningside Park dropped below the instantaneous minimum for the first time since we began monitoring (pg. 33). *Check 2016 and 2017 reports to make sure this is true; the report states that it was above 5 mg/L in 2018, and 2019. This was most likely due to low flow. Specific Conductivity (SpC) Walley Creek is typically well above the guideline of 80 microsiemens(uS)/mL of SpC, the measure of dissolved ions in the water. We believe this to be due to significant groundwater influence, as well as road runoff from the many storm drains that feed Walley Creek from adjacent residential areas. The report states that Walley Creek was above 130 uS/cm on all 10 sampling dates (pg. 49). I don't see our data values on the graph, so I'll inquire whether there was a big difference between our summer and fall readings. We are curious whether mitigating/absorbing road runoff would bring the SpC down, and if this would be a worthwhile activity to improve the overall water quality of Walley Creek. Turbidity Measurement of suspended particles in the water exceeded parameters three times in the summer (pg. 57) and twice in the fall (pg. 58). The fall turbidity readings correlate with significant rain events October 13 (67.3 mm) and November 3 (46.2 mm). The report states that increased turbidity can increase temperature (pg. 51), and thereby lower dissolved oxygen. High summer turbidity can be a result of contaminants, storm water, and erosion. All of these are potentially true in Walley Creek. 2011 - 2020 Data Analysis ReportTEMPERATURE 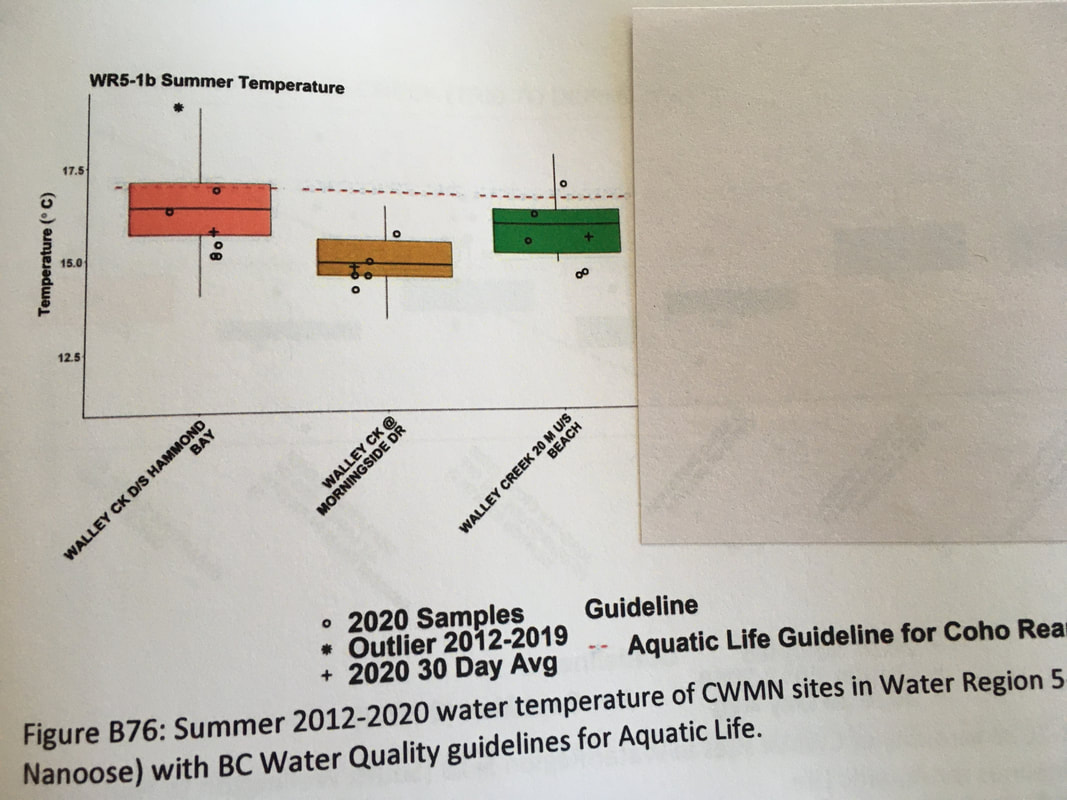 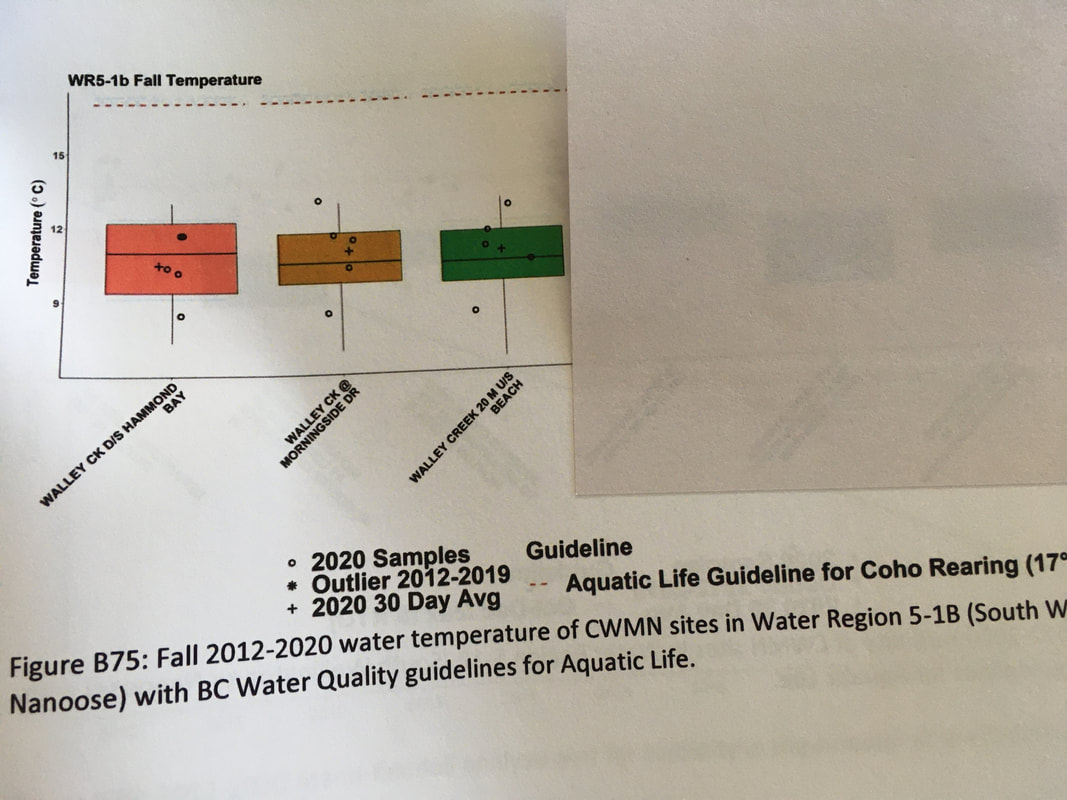 DISSOLVED OXYGEN 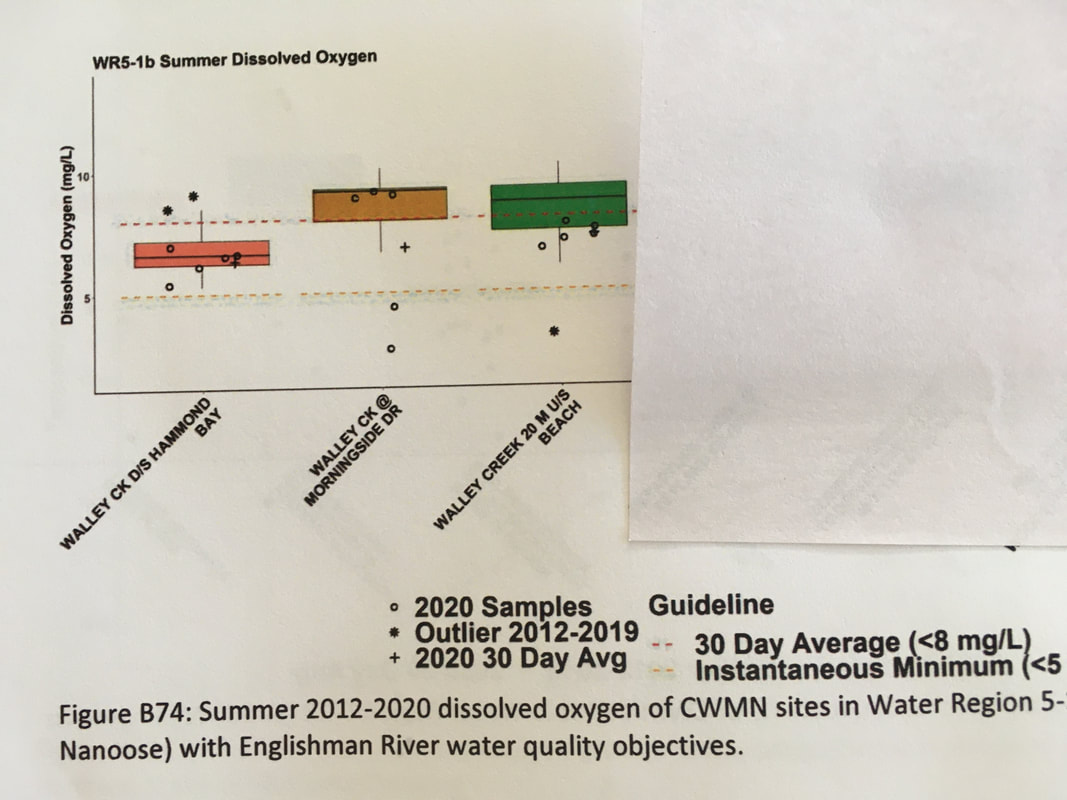 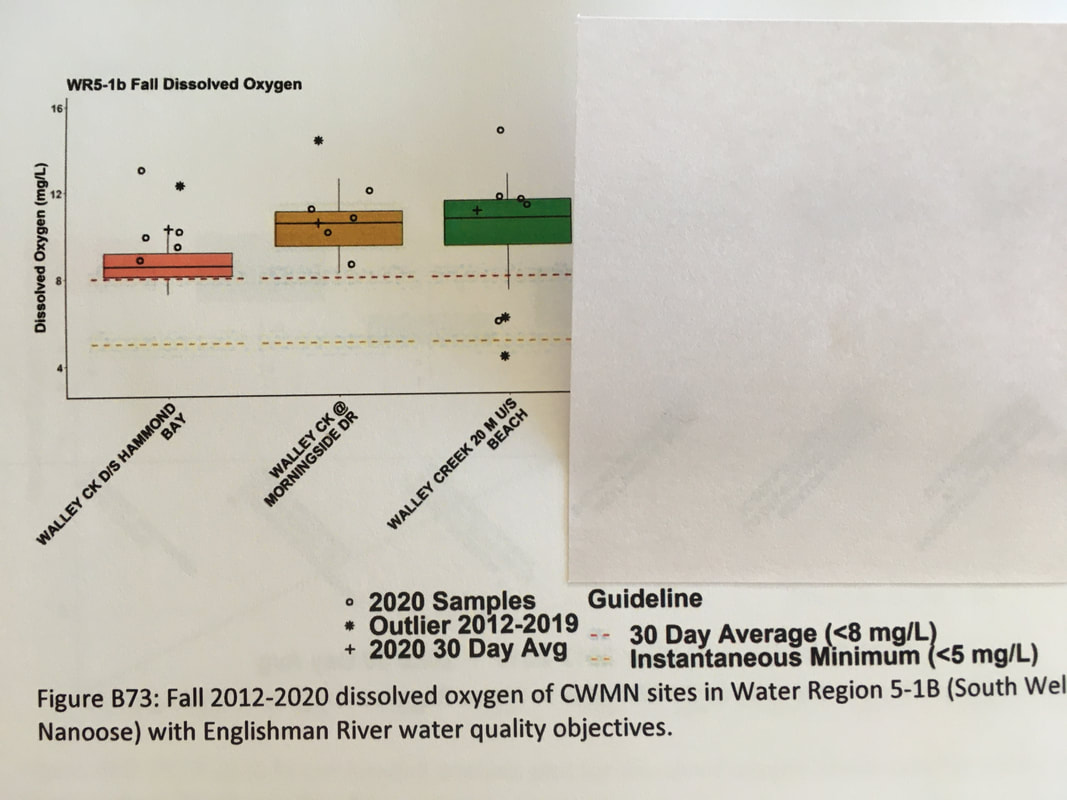 CONDUCTIVITY 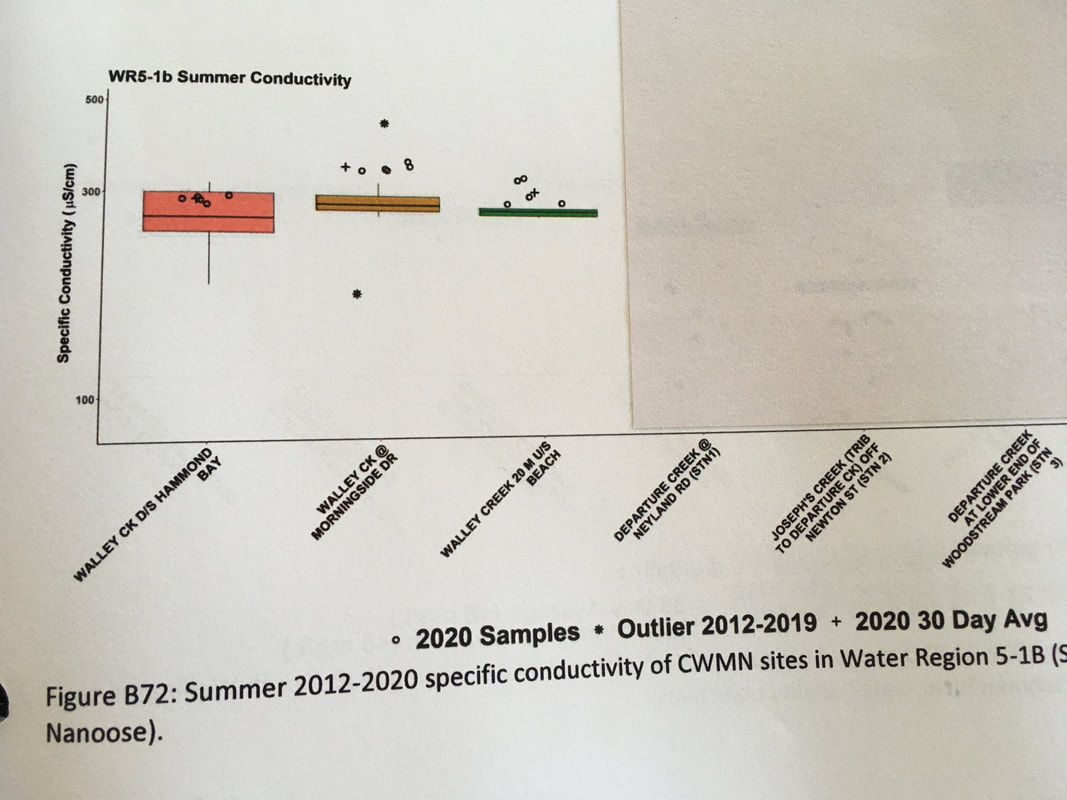 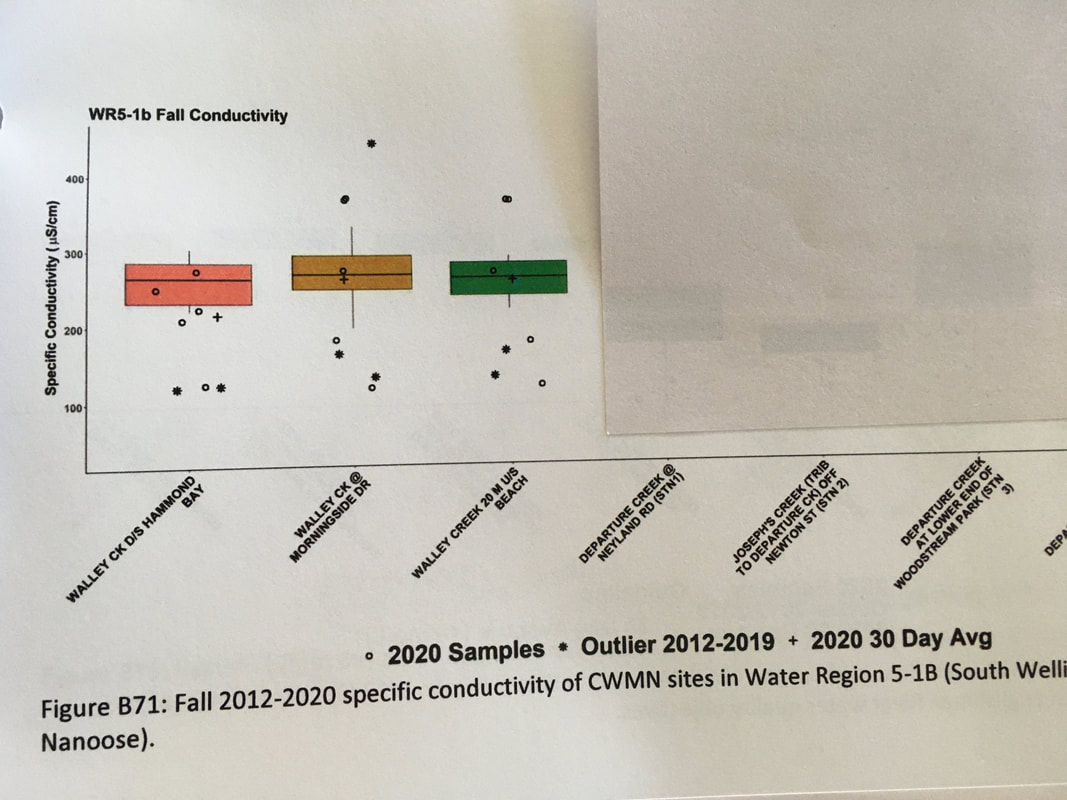 RECOMMENDATIONS: 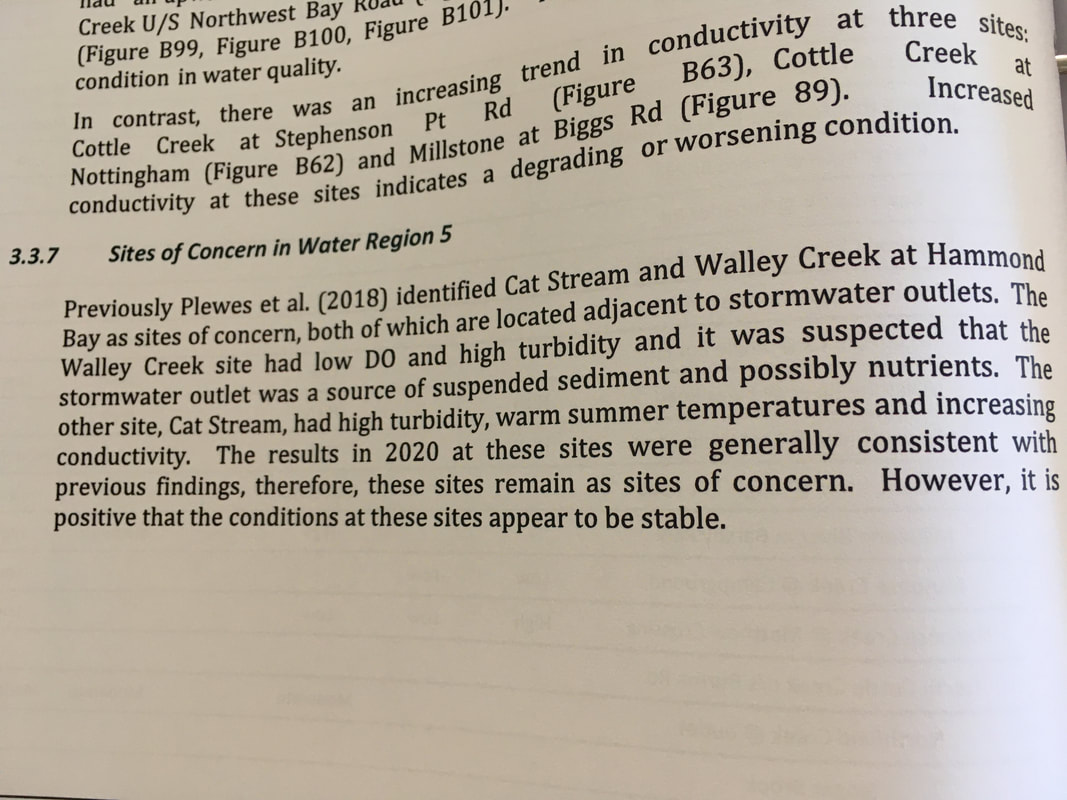 Broader Recommendations, pages 28 - 30 of Community Watershed Monitoring Network Data Analysis (2011 - 2020) prepared by Ecoscape Environmental Consultants Ltd. 2021
Several of these recommendations were provided by Plewes et al. (2018) (2011 - 2017 CWMN trend report), but are included again, as they remain relevant and are important to properly document water quality conditions and to ensure watershed health.
|
Categories
All
Archives
March 2024
|
||||||||
 RSS Feed
